QPlot is a powerful program wich you can allow you view or digitize scatter data
QPlot download
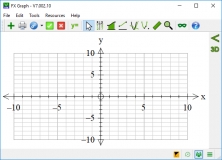
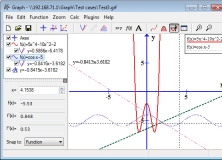
It can be used to draw mathematical graphs in a coordinate system.
Graph Cartesians, polars, parametrics, slope fields, volumes of rotation.
Automatically digitize scanned graphs and output data values.
It can be used for post-acquisition processing of survey measurements.
RJS Graph produces professional scientific and mathematical graphs.

 Free